

A foam part can arrive at the customer with the correct hardness on the data sheet and still fail in service. The insulation panel drifts above its design k-value. The cushion loses resilience after a few thousand loading cycles. The elastomer tears at a stress well below the datasheet figure. In most of these cases the formulation was not the culprit. The cell structure was.
Cell structure is the three-dimensional arrangement of gas pockets trapped inside a polymer matrix, and it is the least forgiving variable in polyurethane processing. You can hold density, hardness, and ratio all within tolerance and still produce a part that fails because the cells are too large, too uneven, or open when they should be closed. This article walks through the structural variables, how they drive performance, and the processing levers that keep them repeatable.

The Three Variables of Cell Structure
A useful way to look at any polyurethane foam or microcellular elastomer is through three measurable, independent quantities: how many cells there are, how big they are, and whether they are open or closed.
Cell size describes the mean diameter of the gas-filled cavities, usually reported with a size distribution. Cell density — the number of cells per unit volume — is the nucleation-side mirror of the same quantity: at a given apparent density, more nuclei produce smaller cells [1]. Open-cell content is the volume percentage of cells whose windows have ruptured so gas can move between cavities; closed-cell content is the remainder. What breaks or holds between cells matters because it controls how the foam breathes, how it insulates, and how it reacts to load and moisture [2][3].
Around those cavities sits the polymer skeleton: struts, the thickened edges where cell walls meet, and cell windows, the thin membranes between them [4].
A practical summary:
| Structural variable | What it primarily controls |
|---|---|
| Open/closed-cell content | Insulation value, water absorption, air permeability, dimensional stability |
| Mean cell size | Thermal conductivity at a given density, surface finish, mechanical strength |
| Cell size uniformity | Even stress distribution, fatigue life, part-to-part consistency |
| Cell density (nucleation) | Load-bearing behavior, weight traded against strength |
| Strut and window geometry | Compression resistance, flexibility, recovery |
Density belongs on the table as a companion, not a substitute. Two foams can hit the same apparent density while differing sharply in open-cell content and cell size, and those differences will decide whether the part meets its functional specification [1].
Open Cells vs. Closed Cells: The Performance Fork
The most consequential distinction in cell structure is whether the cells are open or closed, because it decides whether gas stays trapped inside the part.
In a closed-cell foam, the blowing gas that expanded the polymer remains inside intact windows. The structure stiffens as a result: closed cells resist liquid water uptake and, at a given density, usually carry more load because intact windows transmit stress across a continuous network [5].
That trapped gas is also why closed-cell rigid polyurethane insulation typically measures a thermal conductivity around 0.020–0.028 W/(m·K), while an open-cell material of similar density falls nearer 0.035–0.040 W/(m·K) [6]. The low-conductivity gas inside the closed cells does much of the insulation work; once windows rupture and air can circulate, the value rises.
Open cells earn their place in flexible foams. When the windows have ruptured, air can move through the part and escape on compression, and that airflow is central to seating comfort, acoustic absorption, and recovery after load. Open-cell content also matters for dimensional stability: a closed-cell part can contract as the hot trapped gas cools after demold, while an open-cell structure equalizes pressure more easily [5].
Closed cells hold the blowing gas that inflated the foam. As a molded part cools after demold, that trapped gas contracts, and the foam can pull inward while the polymer still lacks full strength. Causes Of Shrinkage In Polyurethane Foam How To Control It covers the cooling and post-cure controls that stop the contraction before it becomes a dimensional reject.
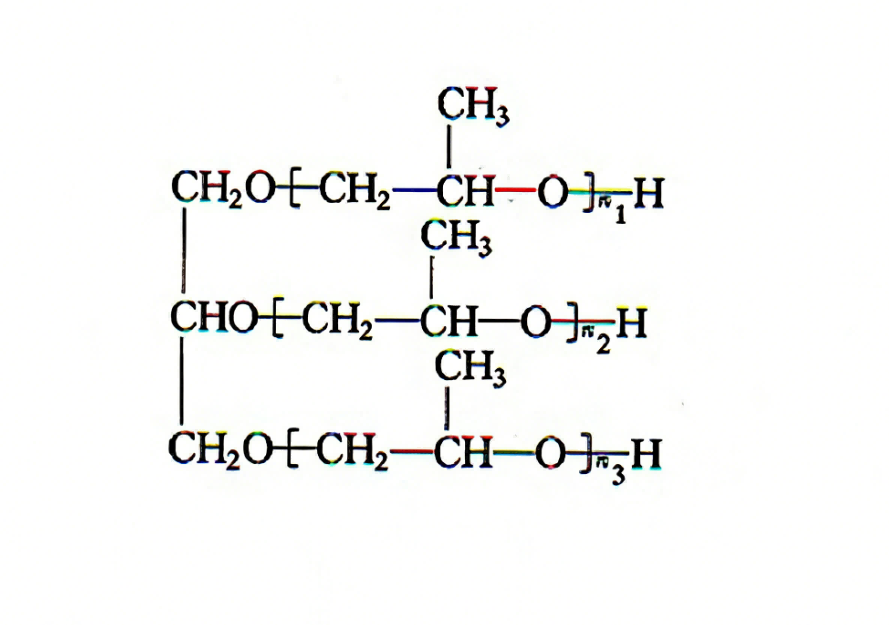
The open/closed balance is set during the reaction, not in a post-process. Two competing processes run in the first seconds after mixing: the blowing reaction generates gas, and the gel reaction builds molecular weight and wall strength. If gelation outpaces gas expansion while the silicone surfactant stabilizes the growing windows, cells remain closed. If gas evolution outruns wall strength — or the formulation is deliberately shifted with catalysts and water to open the windows — the foam becomes open-celled [4][7]. This is why two formulations with identical density can behave completely differently.
Cell Size and Uniformity: Fine Cells Carry Load Better
Once the open/closed balance is set, cell size becomes the next lever. Smaller cells mean more load-bearing struts and windows per unit volume, which generally raises compressive strength and resistance to surface marking. Fine, uniform cells also preserve insulation value: very small cells suppress convection, and as diameters fall toward and below roughly 100 µm, the gas inside conducts less heat through the Knudsen effect [4][6].
Uniformity matters as much as average size. A part with a broad cell-size distribution can pass its average properties while carrying weak zones — areas where a few very large cells concentrate stress, initiate tearing, or open a visible surface defect. In flexible foam this shows up as inconsistent feel and earlier fatigue; in microcellular soles and elastomers it shows up as pinholes and reduced cut-growth resistance [5].
Cell-size defects usually have an identifiable cause, and reading them correctly saves trial batches:
| Cell structure symptom | Common production cause | Performance failure if unchecked |
|---|---|---|
| Large, irregular cells near the surface | Low nucleation, insufficient mixing energy, surfactant shortage | Weak skin, visible roughness, low surface strength |
| Mixed cell sizes across one part | Gas injection instability, pressure fluctuation, incomplete mixing | Uneven hardness, early fatigue, local density drift |
| Collapsed or retracted cells | Blowing outruns gelation, weak cell windows | Low compressive strength, high water absorption |
| Overly fine and dense cells | Excessive nucleation or water, high isocyanate index | Over-stiffness, higher-than-designed density, shrinkage risk |
This is the kind of table worth keeping beside the molding machine. When a part fails, the first question should be which cell-structure symptom it shows, not whether the average density was still in spec.
The Production Variables That Set Cell Structure
Every cell is created at the mixing head, not in the mold. The mold shapes the part; the structure is decided upstream by nucleation, stabilization, and the gel-blow race.
Nucleation establishes how many bubbles start. Air, nitrogen, or carbon dioxide is dissolved or injected into the polyol stream, or fine solid particles such as graphite or carbon black provide nucleation sites; physical blowing agents contribute dissolved gas that leaves solution as bubbles when pressure drops [4][7]. More nuclei at a constant gas volume produce smaller cells. A line that under-nucleates will trend toward large, irregular cells even if every other setting is untouched.
Surfactant — usually a silicone copolymer — stabilizes the expanding bubbles by lowering surface tension and controlling how cell windows drain and thin. Its level shifts the open/closed balance: too little and windows collapse prematurely; too much can over-stabilize and hold cells closed when the application wants airflow [4].
Catalyst and isocyanate index control the timing of the gel-blow race. A fast gel strengthens cell walls before much gas is generated, favoring closed cells and fine structure. A fast blow, often from water reacting with isocyanate to generate carbon dioxide, expands gas while walls are still weak, favoring open cells. The index itself changes crosslink density and wall stiffness, so shifting index can move cell openness and foam hardness at the same time [4][5].
If cells are the outcome, rise time is the visible signature of the reaction race that creates them. The Role Of Rise Time In Polyurethane Foaming covers how that timing window shifts cell size, cell openness, and the density the operator actually measures downstream.
Mixing energy is the variable that shows up last in the laboratory and first on a production line. Polyurethane mixing heads rely on high-pressure impingement, and incomplete mixing looks exactly like a cell-structure defect: ratio deviation on a microscopic scale, uneven nucleation, and sections of a part that are more open than others.
The equipment-side discipline is to hold the variables that feed these mechanisms. On one shoe-sole line we worked on, cell-size scatter traced back to metering pump wear: the A:B ratio drifted within the shot, and the cells near the injection gate came out systematically finer than the cells across the rest of the sole. A deviation of one percentage point in the component ratio can shift final foam density by more than 3 kg/m³, and the cell-size distribution moves with it. Replacing the worn pumps and adding closed-loop servo metering tightened the part-to-part spread and cut the rejection rate at the same time.
If the scatter on your line is coming from metering or mixing rather than the formulation, that is an equipment problem, not a chemistry problem. If you want a second set of eyes on ratio stability, nucleation air, or mixing-head performance, send the batch details and your target cell structure to Info@chinahaifeng.com and we will review it against the process numbers.
Reading Cell Structure as a Quality Signal
Cell structure has to be measured, not assumed. The fastest trap is to treat density as the whole story; density can pass while open-cell content, cell size, or uniformity fail.
The standard measurements are straightforward [1][2][3][8]:
- Apparent density is measured to ISO 845, or by simple mass-over-volume, and gives the polymer content — but it cannot distinguish open from closed cells.
- Open-cell content of rigid foam is measured by air pycnometry to ISO 4590 or ASTM D6226 [2][3].
- Airflow through flexible foam is measured to ASTM D3574 and quantifies how open the structure is, and therefore how the cushion will behave [8].
- Compressive behavior — ASTM D1621 for rigid foam, ISO 3386 or ASTM D3574 for flexible — reveals the mechanical consequence of the structure [8][9][10].
- Visual checks with a clean cross-section cut and image analysis give the cell-size distribution, strut thickness, and surface-cell condition [4].
For production control, the useful habit is to watch open-cell content or airflow alongside density on every shift. A batch can hit density while crossing the open-cell limit, and the customer feels the difference long before the QC data catches up.
Density and hardness tell part of the story; recovery after load tells the rest. Measuring Polyurethane Foam Resilience A Practical Test Guide covers the rebound and indentation tests that connect foam structure to the behavior a customer actually feels.

Before signing off a batch or a trial part, run this five-point check:
- Confirm the open-cell or closed-cell content for the grade, not just the average density.
- Split a cross-section and check for large surface cells, voids, or a visible size gradient.
- Record airflow or open-cell content trended shift by shift; treat a sudden change as a process alarm.
- Verify the A:B ratio and mixing-head pressure from the machine log for the shots that made the parts.
- Compare compressive or indentation results against the previous stable batch, not against a datasheet minimum.
Plan the Foaming Line Around the Cell Structure You Need
Cell structure is not a downstream quality issue; it is decided at the mixing head and protected by the metering, temperature, and ratio-control design of the whole line. That is what we work through when we scope a PU foaming or elastomer casting system.
When you approach us, the questions we ask are structural, because the answers define the machine:
- What is the target open-cell or closed-cell content, and which standard will verify it?
- What cell size and density does the product require, at what shot weight and cycle time?
- Is the foam water-blown, gas-loaded, or physically blown, and what mixing-head pressure and nucleation air does it need?
- How tight does the A:B ratio tolerance need to be to keep the cell structure inside the window?
Tell us the product requirement and the current failure mode — irregular cells, surface pinholes, shrinkage, density drift — and we will trace it back to the process variables that control it. Reach us at Info@chinahaifeng.com or WhatsApp +86 13566296633.
Frequently Asked Questions
Does higher density always mean smaller cells?
No. Density and cell size are independent. Density is set by how much polymer is in a given volume; cell size is set by how many nuclei formed. You can make a dense foam with coarse cells and a lightweight foam with fine cells. The only reliable way to know is to measure.
How much does open-cell versus closed-cell content change insulation?
A lot. Closed-cell rigid foam typically measures in the 0.020–0.028 W/(m·K) range because the blowing gas stays trapped, while open-cell foam of similar density falls nearer 0.035–0.040 W/(m·K) [6]. The trapped gas, not the polymer skeleton, provides most of the insulation advantage.
Why does a part shrink after demold when the formula has not changed?
Shrinkage of this kind usually points to closed cells. The hot blowing gas contracts as the part cools, and if the polymer is still soft, the walls pull inward. An open-cell structure or a controlled post-cure cycle reduces the effect.
Can I change open-cell content without changing the formula?
Yes, within limits. Catalyst balance, surfactant level, mixing energy, nucleation air, and isocyanate index all shift the open/closed balance. These are process dials, and that is why the same formula can produce different cell structure on two machines.
What is the most common equipment cause of inconsistent cell size?
Metering ratio drift and insufficient mixing energy. When the A:B ratio moves during a shot or between shots, nucleation and gelation move with it, and the cell-size distribution follows. Closed-loop metering and stable impingement pressure are the first things to check.
What should I measure first when qualifying a new foam: density or cell structure?
Cell structure. Density is quick and necessary, but open-cell content, cell-size uniformity, and airflow decide whether the part works. Qualify the structure first, then use density as the daily control.
References
[1] ISO 845:2006, Cellular plastics and rubbers — Determination of apparent density, International Organization for Standardization, Geneva, 2006.
[2] ISO 4590:2016, Rigid cellular plastics — Determination of the volume percentage of open cells and of closed cells, International Organization for Standardization, Geneva, 2016.
[3] ASTM D6226-21, Standard Test Method for Open Cell Content of Rigid Cellular Plastics, ASTM International, West Conshohocken, PA, 2021.
[4] G. Oertel, Ed., Polyurethane Handbook, 2nd ed. Munich: Hanser Publishers, 1994.
[5] M. Szycher, Szycher’s Handbook of Polyurethanes, 2nd ed. Boca Raton: CRC Press, 2013.
[6] ASTM C518-21, Standard Test Method for Steady-State Thermal Transmission Properties by Means of the Heat Flow Meter Apparatus, ASTM International, West Conshohocken, PA, 2021.
[7] M. Ionescu, Chemistry and Technology of Polyols for Polyurethanes, 2nd ed. Shawbury: Smithers Rapra, 2016.
[8] ASTM D3574-17, Standard Test Methods for Flexible Cellular Materials — Slab, Bonded, and Molded Urethane Foams, ASTM International, West Conshohocken, PA, 2017.
[9] ASTM D1621-16, Standard Test Method for Compressive Properties of Rigid Cellular Plastics, ASTM International, West Conshohocken, PA, 2016.
[10] ISO 3386-1:1986, Polymeric materials, cellular flexible — Determination of stress-strain characteristics in compression — Part 1: Low-density materials, International Organization for Standardization, Geneva, 1986.
If you’re interested, check out these related articles:
Shore A Vs Shore D Hardness In Polyurethane
How Polyurethane Rollers Are Made From Casting To Cure
RRIM Vs RIM Which Process Suits Your Structural Part
What Is Semi Rigid Polyurethane Foam
Measuring Polyurethane Foam Resilience A Practical Test Guide