Water absorption looks like a simple lab number, but in polyurethane parts it is one of the first signals of formulation quality, cure completeness, and dimensional stability in wet service. A specimen that gains 1.5% mass after a 24-hour soak instead of 0.4% is usually telling you something about porosity, incomplete cure, or a polyol backbone that is not suited to the operating environment. This guide explains how to run the measurement with ASTM D570 and ISO 62, what the result does and does not tell you, and which process variables shift the number.
Why Water Absorption Matters in Polyurethane Parts
Water uptake changes four things in a polyurethane part: dimensions, mechanical response, electrical behavior, and long-term durability in moist environments.
A small mass increase can swell a precision roller, seal, or rail pad enough to alter fit and preload. Absorbed water can plasticize the hard segments and reduce modulus; in materials with hydrolytically sensitive ester linkages, the same water can contribute to chain scission over time rather than causing only temporary softening. In electrical encapsulation or insulation parts, moisture raises dielectric loss and reduces insulation value. In cellular material, absorption can also indicate cell-wall defects or a surface skin that is not fully continuous.
Water uptake becomes a dimensional problem before the part fails. A few tenths of a percent of moisture may be negligible in a cushion, but it can be critical in a metering-pump seal, a rail pad, or a printing roller where dimensions and preload are controlled to tight tolerances. Moisture gain also interacts with residual shrinkage after demold, because both respond to conversion and crosslink density.
Water absorption and shrinkage are often controlled together because both respond to formulation and cure completion. Causes Of Shrinkage In Polyurethane Foam How To Control It covers the processing variables that drive size change after demold.
What the Standards Actually Measure
ASTM D570 and ISO 62 are the two references most frequently called out for solid plastics and polyurethanes. Both report water absorption as the percentage increase in specimen mass after controlled exposure to water. The baseline condition is distilled or deionized water at 23 ± 1 °C for 24 hours, but the two standards differ in the longer and accelerated methods they define [1][2].
| Item | ASTM D570 | ISO 62 |
|---|---|---|
| Base condition | 24 h immersion in distilled water at 23 ± 1 °C | 24 h immersion in distilled water at 23 °C |
| Additional methods | Long-term immersion; accelerated hot-water procedure | Long-term to saturation; boiling-water method |
| Main result | Percentage mass increase | Percentage mass increase; water-soluble matter loss may be reported separately |
| Specimen form | Disks or bars with specified thickness | Plaques or disks with thickness and edge condition controlled |
The result is a total mass gain, not a location profile. It will not tell you whether water is sitting on the surface, trapped in open pores, or absorbed into the polymer matrix. If the part has open cells, much of the gain may be retained liquid rather than polymer uptake; a method written specifically for cellular materials, such as ISO 2896, is more appropriate when drainage time and retained water volume matter [5].
If the service fluid is not pure water, ISO 175 provides the wider immersion framework. For polyurethane in humid or wet service, water absorption is a useful first screen, but it is not a substitute for chemical resistance testing under actual service exposure [3].
Specimen Preparation and Conditioning
Use at least three replicate specimens. Five is better for a new formulation because cut edges, surface drying, and small porosity create more scatter than the balance itself.
Record dimensions and mass before conditioning. A common path is to dry the specimens in a ventilated oven at 50 °C until two successive weighings agree to a small tolerance, then cool them in a desiccator before the initial weighing [4]. Do not touch dried specimens with bare hands; skin oil and moisture can add measurable mass.
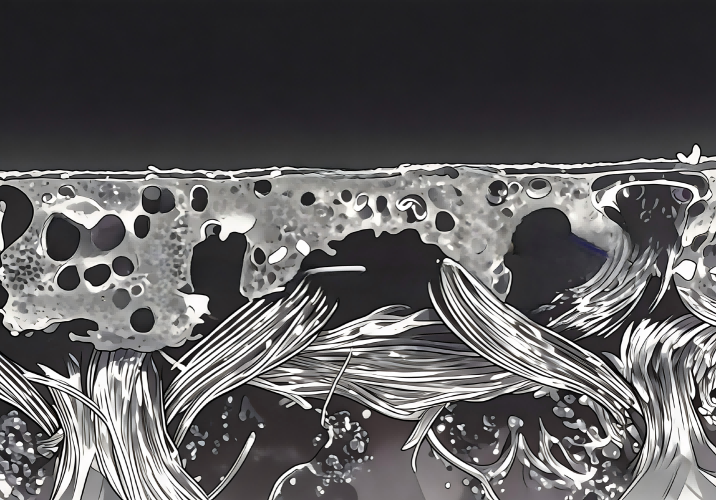
Cut edges matter. Water enters a solid specimen first at exposed cut surfaces. Larger specimens reduce the edge contribution relative to total volume, but they also increase the time needed to reach saturation. Keep specimen size and preparation consistent across a study; do not compare a 1 mm coupon to a 12 mm block.
For cast elastomer specimens, inspect the cut faces under magnification before testing. A single gas bubble from incomplete degassing gives water a free path and can masquerade as high material absorption.
Step-by-Step Procedure: 24-Hour Immersion
- Weigh each conditioned specimen to obtain the dry mass, W₁.
- Place specimens in a clean container of distilled or deionized water at 23 ± 1 °C. Do not stack them. Separate specimens so all faces are exposed, and gently stir the water if the selected method requires circulation [1][2].
- Soak for 24 hours. If trend data is needed, continue the same specimens for 48 hours, 168 hours, or the specified interval.
- Remove each specimen and blot surface water with a clean, dry, lint-free cloth. Work the same way for every specimen; the time between removal and weighing changes the result.
- Weigh immediately to obtain the wet mass, W₂.
- Calculate water absorption:
Water absorption (%) = (W₂ - W₁) / W₁) × 100
- If water-soluble additives or reaction by-products leach out, dry the specimen again and record the final mass, W₃. The soluble-matter correction is:
Water-soluble matter lost (%) = (W₁ - W₃) / W₁) × 100
Report the standard, method variant, specimen dimensions, conditioning history, immersion temperature, soak duration, and number of replicates. A value reported without those details is not useful for comparison.
Mid-Process Check: When the Number Does Not Match the Target
If the result is high but the specimen appears solid and pore-free, check the weighing and drying steps first. One droplet left on a small specimen is enough to shift the result by more than a percentage point. Then inspect prepared cut faces for bubbles, cracks, or a rough surface layer that holds water mechanically.
Haifeng Polyurethane Machinery works with processors who need to separate equipment effects from formulation effects in cast elastomer and foam lines. If you are getting water absorption values you cannot explain, send the test data and a photo of the cut specimen to Info@chinahaifeng.com; we can help you trace whether the source is mixing, degassing, or cure before you spend more time on the formula.
Factors That Skew the Result
- Surface water: Inconsistent blotting is the largest source of repeatability error.
- Cut edges: Exposed porosity and rough edges hold liquid; compare specimens with the same edge preparation.
- Water temperature drift: Absorption rate changes with temperature; a 1–2 °C drift can move the 24-hour result.
- Incomplete drying before the test: A specimen that starts humid already contains water that will be counted as uptake.
- Incomplete cure: Low conversion leaves a more open network and can increase true absorption.
- Microporosity: Entrapped gas creates internal surfaces and liquid traps; use vacuum degassing or check mixing quality.
- Soluble material loss: If additives or low-molecular-weight species leach out, the simple mass-gain formula understates total water entry [2].
- Specimen geometry: Surface-to-volume ratio and exposed cut area affect both the rate and the apparent result.
For flexible and semi-rigid cellular polyurethane, open-cell networks hold water by capillarity. The measured gain is not primarily polymer uptake; it is retention of liquid within the cell network. That is why drainage time, compression, or vacuum steps become part of the test rather than a simple 24-hour soak [5].
Cell structure changes how water enters and leaves a part. What Is Semi Rigid Polyurethane Foam covers the structural differences that affect absorption, drainage, and recovery in cellular polyurethane.
Reading the Result in a Production Context
A water absorption value is only meaningful when the method is fully defined. A data sheet that lists “water absorption 1.2%” without immersion time, specimen thickness, and temperature cannot be compared with another material. Before accepting a limit, confirm the standard, the method variant, and the conditioning procedure.
In production, water absorption is better used as a qualification gate than as a batch-level release test. Track the value for a new polyol, filler package, catalyst balance, or cure cycle, then compare against a control formulation using identical test conditions. If the number drifts upward over several lots, investigate raw-material moisture, incomplete degassing, mixing ratio deviation, mold temperature, and post-cure time in that order.
Water absorption is best understood as part of a small test battery. Run it alongside hardness, density, resilience, or compression set depending on part function; a single number rarely explains a field failure.
Talk to a Polyurethane Processing Engineer
If you need help building water absorption testing into an incoming-material or finished-part qualification plan, contact Haifeng Polyurethane Machinery. Send the standard you are working to, the current result, and a photo of the specimen cut face.
Email: Info@chinahaifeng.com
WhatsApp: 86 13566296633
What to include in the inquiry:
- Target standard and method variant
- Material system and specimen preparation
- Current values and number of replicates
- Photos of the cut face or fracture surface
- Part function and wet service conditions
Frequently Asked Questions About Water Absorption Testing
Is ASTM D570 or ISO 62 better for polyurethane?
Neither is better in absolute terms. ASTM D570 is common in North American specifications, while ISO 62 appears more often in European and international documentation. Use the one your customer or certification body requires and state it on the report. The 24-hour baseline conditions are close, but the long-term and accelerated variants are not identical [1][2].
How many specimens should be tested?
Test at least three. For a new formulation or an alternative raw material, five specimens usually gives a more reliable average because cut edges, small porosity, and surface drying create more scatter than the balance.
What is a typical water absorption value for polyurethane?
There is no single pass/fail number. Solid cast elastomers used in dry ambient service are often specified below 1% after 24 hours, while open-cell flexible foam can retain far more because the test captures liquid held in the cell network rather than matrix uptake. Always compare against a control formulation using identical test conditions [1][2].
Why is my result higher than the raw material datasheet?
Datasheet values are usually generated on fully cured, void-free standard plaques after defined conditioning. Production specimens may contain microporosity, include rough cut edges, be tested at a different thickness, or may not be fully cured. Differences in surface-water removal also move the result.
Can I use tap water for the immersion test?
Preferably not. Dissolved minerals and chlorine can deposit on the specimen or interact with the surface. Standards specify distilled or deionized water because the result should reflect the polymer and its preparation, not local water chemistry [1][2].
References
[1] ASTM International. Standard Test Method for Water Absorption of Plastics. ASTM D570-22. West Conshohocken, PA: ASTM International, 2022.
[2] International Organization for Standardization. Plastics — Determination of Water Absorption. ISO 62:2008. Geneva: ISO, 2008.
[3] International Organization for Standardization. Plastics — Methods of Test for the Determination of the Effects of Immersion in Liquid Chemicals. ISO 175:2010. Geneva: ISO, 2010.
[4] ASTM International. Standard Practice for Conditioning Plastics for Testing. ASTM D618-21. West Conshohocken, PA: ASTM International, 2021.
[5] International Organization for Standardization. Flexible Cellular Polymeric Materials — Determination of Water Absorption. ISO 2896:2001. Geneva: ISO, 2001.
If you’re interested, check out these related articles:
Shore A Vs Shore D Hardness In Polyurethane
What Is Spray Polyurethane Foam Composition And Application
RRIM Vs RIM Which Process Suits Your Structural Part
How Polyurethane Rollers Are Made From Casting To Cure