

Rigid polyurethane foam is usually specified by density, thermal conductivity, and closed-cell content. Compressive strength is often treated as an afterthought until a panel cracks during handling, a laminated core delaminates, or a pipe support settles under load. When that happens, the cause is rarely just low density. More often it is a mismatch between the test value, the foam structure, and how the part was actually filled.
Why Compressive Strength Matters in Rigid Polyurethane Foam
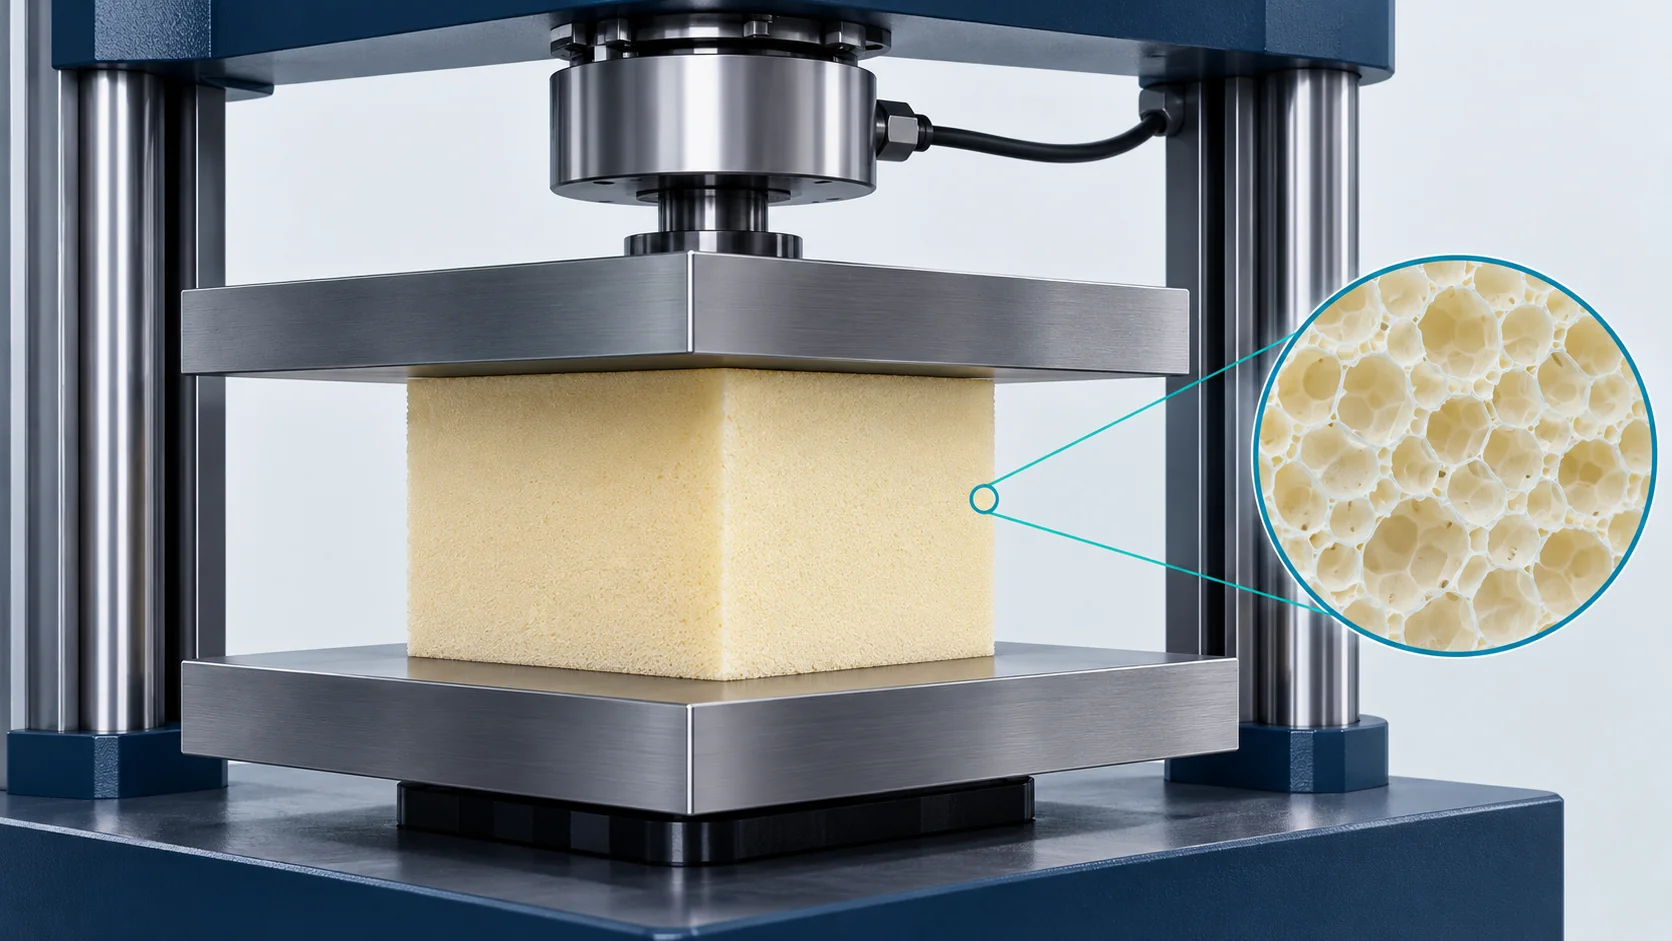
Compressive strength in rigid polyurethane foam is the stress required to produce a defined deformation, usually 10% of specimen thickness, or the maximum stress observed before that deformation is reached [1][2]. Because rigid foams are cellular solids, their stress–strain curve does not look like a solid elastomer. After an initial elastic region, the cells begin to buckle. The curve flattens, then rises steeply once the cell walls densify. This plateau is exactly why a single density number does not tell the whole story.
Foam carries load through its cell walls and struts. If the cells are coarse, irregular, or partly open, the load path is weaker even when the formulation is unchanged. Compressive strength therefore works as an indirect quality check on how well the foam structure was built, not just on how much material was weighed into the mold.
What Actually Moves the Number
Several variables interact before a compression test produces a value.
Apparent density is the strongest first-order variable. More polymer in the same volume means more cell-wall material carrying load, and the relationship is nonlinear at low density. Density should be measured separately with ISO 845 or ASTM D1622 so the compressive value can be compared at a known core density [3].
Cell geometry and closed-cell content matter next. Small, uniform, closed cells distribute stress better than large cells or a partly collapsed structure. A foam can have acceptable average density but fail compression because locally collapsed cells create weak planes.
Crosslink density is the chemistry-side lever. Higher-functionality polyols, a near-optimal isocyanate index, and controlled water content change the rigid polymer network. The structural argument for foam mechanical properties is covered in the standard polyurethane reference literature [4].
Hardness and compressive strength are not interchangeable. Shore A and Shore D readings reflect a surface indentation response; compressive strength is a bulk stress over the entire specimen area. A rigid foam can be hard on the skin while a soft, low-density core collapses early, or it can show moderate hardness but high compressive resistance because the closed-cell structure distributes load well.
Hardness readings are easy to confuse with load-bearing ability. Shore A Vs Shore D Hardness In Polyurethane covers which hardness scale applies to rigid and semi-rigid polyurethane parts and what each reading actually represents.
Mass in the mold is the starting point for both density and compression response. How To Calculate Shot Weight In Polyurethane covers the calculation steps and overpack assumptions behind a repeatable fill.
Compression failures often appear beside voiding or shrink-related cross-section loss. Causes Of Shrinkage In Polyurethane Foam How To Control It covers the process causes and control methods.

How Compressive Strength Is Measured
ASTM D1621 compresses a specimen between parallel platens and reports compressive strength at yield, or at 10% deformation if yield does not occur earlier [1]. ISO 844 similarly reports compressive stress at 10% relative deformation, or maximum compressive strength if failure occurs earlier [2].
Both methods are sensitive to specimen preparation. A cut core sample and a sample with intact molded skins can give different answers even when the nominal foam grade is identical. The test direction also matters because foam is anisotropic.
| Standard | What it reports | Practical note |
|---|---|---|
| ASTM D1621 | Compressive strength at yield or 10% deformation | Note whether skins are present |
| ISO 844 | Compressive stress at 10% relative deformation | Report test direction and specimen thickness |
| ISO 845 / ASTM D1622 | Apparent density | Run alongside compression for comparison |

Targets, Direction, and Machine Variables
Specify the Job, Not a Single Number
Instead of asking a supplier for high compressive strength, a workable specification states the standard, test direction, deformation level, density, and temperature. For building panels and pipe insulation, the value in the foam rise direction usually matters most because that is how the material carries service load. For tooling board and structural cores, compression modulus and creep often matter as much as peak strength.
How the Foaming Machine Changes the Result
Compressive strength is also a process output. Metering ratio drift changes the effective isocyanate index, and therefore density and crosslinking. A high-pressure mixing head that does not reach full mixing pressure leaves coarse or uneven cells. A pour pattern that deposits material unevenly creates local density differences that no average density reading will catch.
On a well-instrumented high-pressure line, servo metering and closed-loop temperature control keep these variables inside a narrow band. On a poorly maintained machine, the foam can drift long before the operator sees it. That is why compressive testing should be paired with process data, not treated as a standalone material property.

Get the Compression Target Into the Quote
Before comparing machines, fix the test standard, specimen direction, target density, and minimum compressive value. If you have a sample that passed the lab but failed in the field, send the part data, filling pattern, and current machine parameters to Info@chinahaifeng.com. The discussion becomes more productive when the target is a number under a named test method rather than a general request for stronger foam.
Get the Specification Mapped to Your Line
Compressive strength is an outcome, not a parameter you set on a dial. It comes from the interaction of density, cell structure, fill pattern, mold temperature, and cure. If you are qualifying a new part, tightening a customer specification, or replacing a line that drifts, send the target value, sample dimensions, test standard, and current density data. Haifeng Polyurethane Machinery can match metering accuracy, mixing head type, and mold-carrier configuration to the number you actually need to hit. Email Info@chinahaifeng.com or WhatsApp +86 13566296633.
Frequently Asked Questions
Is compressive strength the same as hardness?
No. Hardness is a surface indentation measurement. Compressive strength is a bulk stress applied over the specimen area. The two often trend together in rigid foam, but a dense skin or a locally collapsed core can separate them.
Does a molded skin change the compressive test result?
Yes. A specimen with intact molded skins usually tests differently from a cut core specimen because the skin carries part of the load. Always state whether the reported value includes skin material when comparing results.
Can a foaming machine change compressive strength without changing chemistry?
Yes. Metering ratio, mixing quality, pour pattern, mold temperature, and fill volume affect density and cell structure. A stable machine can hold the foam closer to its intended structure; a drifting machine can move the result without any formulation change.
What should I specify for a building panel?
State the test standard, test direction, deformation level, required minimum compressive strength, and density. This is more repeatable than quoting a product name or saying the panel must be rigid.
References
[1] ASTM D1621-16, Standard Test Method for Compressive Properties of Rigid Cellular Plastics, ASTM International, West Conshohocken, PA, 2016.
[2] ISO 844:2021, Rigid cellular plastics — Determination of compression properties, International Organization for Standardization, Geneva, 2021.
[3] ISO 845:2006, Cellular plastics and rubbers — Determination of apparent density, International Organization for Standardization, Geneva, 2006.
[4] Oertel, G., Polyurethane Handbook: Chemistry – Raw Materials – Processing – Application – Properties, 2nd ed., Hanser Publishers, Munich, 1994.
If you’re interested, check out these related articles:
Shore A Vs Shore D Hardness In Polyurethane
Measuring Polyurethane Foam Resilience A Practical Test Guide
How To Calculate Shot Weight In Polyurethane