
A polyurethane reaction profile is not a pass/fail lab record. It is a time-based fingerprint of how your polyol, isocyanate, catalyst, water, surfactant, and machine settings interact. Read it as a process signature, and it tells you where to correct the line. Read it as a single number, and you can easily adjust the wrong variable and turn a small drift into a full batch of scrap.

What a Reaction Profile Actually Tells You
A reaction profile records how the liquid mixture moves from first contact between the A-side and B-side to a dimensionally stable part. The core outputs are time, temperature, height, and visual state. The value comes from comparing identical tests over time: same dispense weight, same cup or mold geometry, same material temperature, and same ambient conditions.
Under ASTM D7487, the polyurethane foam cup test records cream, gel, rise, and tack-free times under controlled mixing and temperature [1]. That standard method exists because small changes in test conditions shift the profile more than many operators expect. A 200 g cup test and a 2 kg mold shot can show meaningfully different timing even with the same formulation because exotherm and surface-to-volume ratio differ.

The Five Times That Define the Profile
Five measurements do most of the diagnostic work.
- Cream time: the time from start of mixing to the first visible clouding or color change. It marks the beginning of nucleation and gas formation.
- Gel time: the time at which the mixture becomes stringy and no longer flows. Some plants call this string time.
- Rise time: the time to reach maximum visible foam height in a free-rise cup.
- Tack-free time: the time at which the surface no longer sticks to a clean probe.
- Demold time: the time at which the part has enough green strength to be removed without tearing or distorting.
Two supporting readings matter just as much: exotherm peak and free-rise density. Peak temperature shows how much heat the reaction releases and how quickly it releases it. Free-rise density, measured after rise, exposes ratio drift even when all the times look normal.
Reading Each Stage as a Process Signal
Cream time is a mixing signal. A longer-than-expected cream time usually points to low material temperature, weak catalyst activity, or insufficient mixing shear. A cream time that shortens sharply often means higher temperature, too much catalyst, or water activity moving too early. In complex molds, cream time controls how far the material flows before nucleation locks in the cell structure.
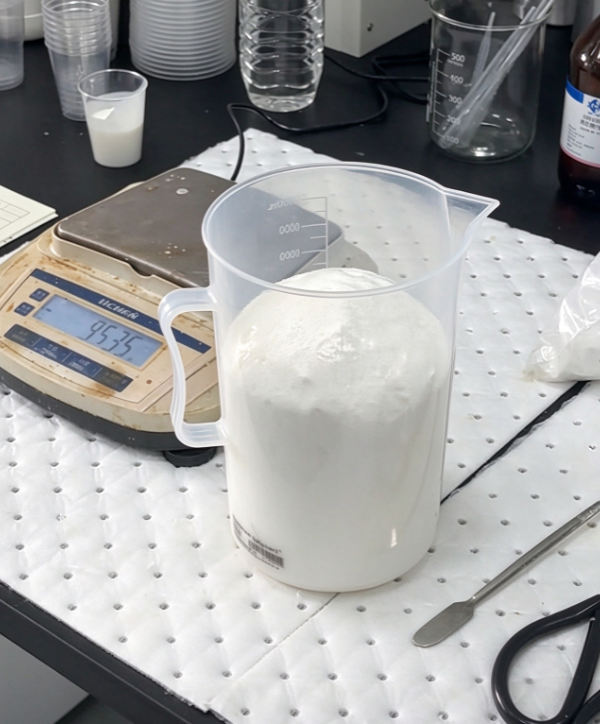
Gel time and rise time must be read together. The gap between them is the blowing/gelling balance. If rise time runs far ahead of gel time, the foam may still be expanding while the polymer network is too weak to hold cell walls, producing coarse or collapsed cells. If gel time runs ahead of rise time, the material can stop flowing before the mold fills, or density climbs because expansion was cut short. One number without the other is nearly useless for troubleshooting.
Tack-free time is not cure time. A dry surface means the part can be handled or stacked without surface damage. It does not mean the core has reached final strength. Many parts that are tack-free in minutes still need post-cure time to stabilize hardness, compression set, and dimensional accuracy [2].
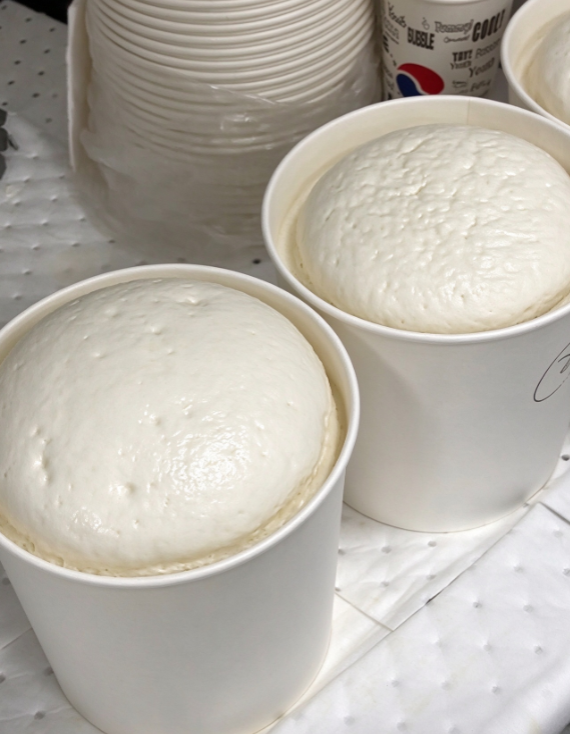
Exotherm is the hidden variable. A high, early exotherm can accelerate cure but risks scorching thick sections. A low, slow exotherm may extend demold time and lower line output. Tracking time-to-peak alongside the visual times tells you whether a formulation is slowing down or losing heat transfer through the mold.
From Profile to Machine Settings
The profile is your early warning for metering and temperature drift. A shift of about one percentage point in component ratio can change free-rise density by more than 3 kg/m³ and pull rise time in either direction. That is why every profile record should be paired with free-rise density and actual material temperatures, not just the setpoints on the machine screen.
If cream time drifts longer while raw material temperature is stable, check metering accuracy and mixing head condition before touching the formula. If rise time is stable but density wanders, check the shot weight and ratio first. The profile often points to the equipment correction before a formulation change is justified.
Before you interpret a profile, the shot weight must be correct for the mold. Cómo calcular el peso de dosificación en poliuretano covers the cup-to-mold calculation that keeps your measured times representative.
On a high-pressure line I once saw rise time remain stable for most of a shift while gel time slowly lengthened. The shift crew kept adding catalyst, but the real cause was a worn mixing head losing shear. Replacing the mixing head brought gel time and cell structure back without changing the formulation. The profile had flagged the problem hours before visible defects appeared.
If you are collecting these times by hand and still seeing density drift or variable demold, send your current profile data and machine settings to info@chinahaifeng.com or WhatsApp +86 13566296633. A complete profile usually points to the right correction faster than a full reformulation cycle.
Common Misreads That Cause Scrap
The most common error is using cream time alone as a quality gate. Cream time may stay normal while ratio, mixing, and exotherm problems quietly change gel and rise behavior.
Comparing profiles taken at different room temperatures is another frequent mistake. A shift of a few degrees in material temperature can move every time in the profile. Always log ambient temperature, material temperature, and mold temperature beside the reaction data.
Tack-free time is also frequently mistaken for demold readiness. In rigid and microcellular parts, the surface can feel dry while the core is still too weak for demold forces. This shows up later as dimensional change, internal stress, or surface defects.
If the profile looks normal but parts still shrink after demold, the cause often sits in cure and mold temperature rather than the foam reaction itself. Causas de la contracción en la espuma de poliuretano y cómo controlarla covers the post-rise mechanisms that distort final dimensions.
Need Help Reading Your Reaction Profile?
A reaction profile is most useful when it is collected the same way every time and read as a set of related times, not as isolated numbers. If you are unsure which variable to correct, review your recorded profile with a process engineer before changing the formulation.
For help interpreting cream, gel, rise, tack-free, and demold data from your current line, contact Haifeng Polyurethane Machinery at info@chinahaifeng.com or WhatsApp +86 13566296633. Include a short description of your material system, dispense weight, and machine settings, and we can help you turn the profile into a clear correction plan.
Preguntas frecuentes
What is the difference between gel time and rise time?
Gel time is the point where the reacting mixture thickens and stops flowing. Rise time is the point where visible foam expansion reaches its maximum height. Gel time helps you judge flow window and polymer network formation, while rise time shows expansion speed and blowing efficiency.
Why does my reaction profile change from winter to summer?
Polyurethane reaction speed is strongly temperature-dependent. Lower material temperature in winter slows catalyst activity, lengthens cream time, and can reduce final rise. Higher summer temperatures accelerate the reaction and can shorten flow time. Always log material and ambient temperature with every profile.
Can I use a cup test result to set mold demold time?
Cup test results are a useful reference, but they do not replace mold trials. Mold geometry, shot mass, mold temperature, and heat transfer change exotherm and cure speed. Use the cup profile for trending and ratio checks, then confirm demold time on the actual part.
What if cream time is normal but rise time is too long?
Check the gel-to-rise balance and the blowing catalyst, water content, and surfactant level. Slow rise with normal cream time often indicates weak blowing activity or a gelling reaction that is building network strength too early. It can also point to poor mixing or low material temperature that does not show clearly in cream time alone.
Referencias
[1] ASTM International, ASTM D7487-18: Standard Practice for Polyurethane Raw Materials: Polyurethane Foam Cup Test, West Conshohocken, PA, USA, 2018.
[2] G. Oertel, ed., Polyurethane Handbook, 2.ª ed. Múnich, Alemania: Hanser Publishers, 1994.
[3] M. Szycher, Szycher's Handbook of Polyurethanes, 2.ª ed. Boca Raton, FL, EE. UU.: CRC Press, 2012.
Si te interesa, echa un vistazo a estos artículos relacionados:
El papel del tiempo de subida en el espumado de poliuretano
Cómo se fabrican los rodillos de poliuretano, desde la colada hasta el curado
Causas de la contracción en la espuma de poliuretano y cómo controlarla
RRIM frente a RIM: qué proceso se adapta mejor a tu pieza estructural
Medición de la resiliencia de la espuma de poliuretano: guía práctica de ensayo
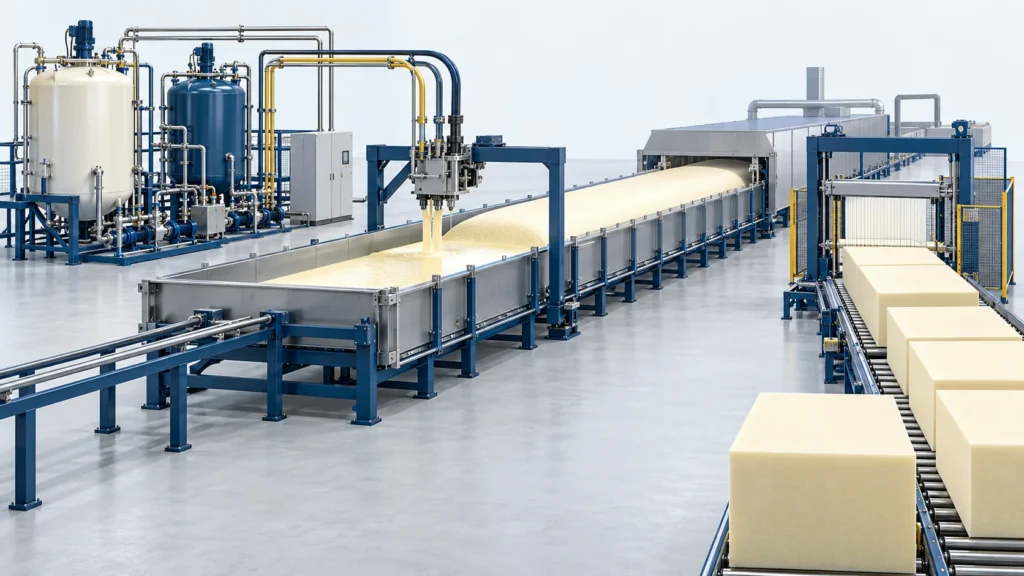
What is polyurethane foam made of, and how does it rise?
A polyurethane foam formulation usually starts with a polyol blend and an isocyanate component. A blowing mechanism creates gas as the reacting mixture forms a polymer network around the bubbles. Catalysts, surfactants and other additives help balance the speed of expansion and setting. The choice of formulation and cooling or curing conditions affects polyurethane foam structure, including the sizes of cells and the degree to which their walls remain open.
How is polyurethane foam made in a mold? Meter the two sides at the specified ratio and temperature, mix and fill while the liquid can reach the edges, then measure the cured part at the defined conditioning time. For polyurethane molded foam, compare the freely risen sample with the part from the actual mold. A free-rise result alone leaves out part thickness, vents, leakage and fill-path effects. Compare the free-rise and molded density guide y la polyurethane foam process selection guide.
See the PU foam manufacturing quality-control guide for ways to connect a reaction profile to accepted output and records from a production run.